NEXT STORY

Algorithmic and historiographic analysis
RELATED STORIES

NEXT STORY

Algorithmic and historiographic analysis
RELATED STORIES


|
Views | Duration | |
|---|---|---|---|
| 61. A job offer and teaching at the University of Pennsylvania | 41 | 03:06 | |
| 62. Sharing information and encyclopedists | 47 | 04:43 | |
| 63. The Atlas of Science | 46 | 02:59 | |
| 64. The Atlas of Science as a dynamic projection | 36 | 02:02 | |
| 65. Algorithmic and historiographic analysis | 37 | 06:38 | |
| 66. The future of open access and retractions in citations | 49 | 05:02 | |
| 67. Duplication in research and a citator for patents | 33 | 04:40 | |
| 68. Citing in patents and papers | 46 | 05:52 | |
| 69. Errors and how they affect retreival | 34 | 03:01 | |
| 70. The mathematics in papers today | 53 | 01:31 |


A dynamic Atlas of Science, meaning that it would generate the usual co-citation clustering maps, but you would re-cluster the file based on every week’s accumulation of data, let’s say, and then you would generate a new map every week, and then you could project the image of that map as a moving target so that you could see how new fields were emerging, in a very visual, dynamic way. Whereas now you’ve got a kind of extrapolate visually from one year to the other, you can cluster every year but the changes are significant because of the way in which the clustering occurs, whereas on a, on a week-by-week basis you probably wouldn’t, it would be not as sensitive to the changes, right. So, that’s an experiment that still ought to be done. I think it would be fascinating to see it. Hasn’t the memory changed in such a way that you could do that in such a way?
[Q] Yes. I’m pretty sure we could do it.
Can that be done on a PC with multiple gigabytes of memory?
[Q] Probably.
I think people would love that, and it’s something we've always wanted to do. That’s the kind of visual display we should have had for that thing we had in New York; not this other stuff. They had that exhibit, by the way, down at Oak Ridge at the science museum.
[Q] Very static.
And your picture is up on the wall, by the way, which I was very proud of. So, that was another interesting project that we didn’t quite complete, and something that needs to still be done, I think; it could be very useful. And I think we ought to get over the hump of people’s resistance to using that sort of thing, you know.
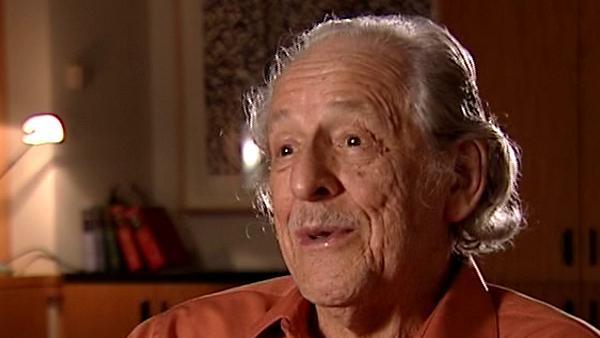
Eugene Garfield (1925-2017) was an American scientist and publisher. In 1960 Garfield set up the Institute for Scientific Information which produced, among many other things, the Science Citation Index and fulfilled his dream of a multidisciplinary citation index. The impact of this is incalculable: without Garfield’s pioneering work, the field of scientometrics would have a very different landscape, and the study of scholarly communication would be considerably poorer.
Title: "The Atlas of Science" as a dynamic projection
Listeners: Henry Small
Henry Small is currently serving part-time as a research scientist at Thomson Reuters. He was formerly the director of research services and chief scientist. He received a joint PhD in chemistry and the history of science from the University of Wisconsin. He began his career as a historian of science at the American Institute of Physics' Center for History and Philosophy of Physics where he served as interim director until joining ISI (now Thomson Reuters) in 1972. He has published over 100 papers and book chapters on topics in citation analysis and the mapping of science. Dr Small is a Fellow of the American Association for the Advancement of Science, an Honorary Fellow of the National Federation of Abstracting and Information Services, and past president of the International Society for Scientometrics and Infometrics. His current research interests include the use of co-citation contexts to understand the nature of inter-disciplinary versus intra-disciplinary science as revealed by science mapping.
Duration: 2 minutes, 2 seconds
Date story recorded: September 2007
Date story went live: 23 June 2009