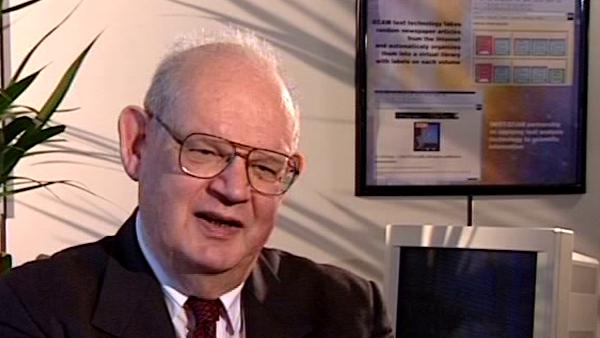
Lately I have been presenting my work in parallel, in two forms. One is the sophisticated form, I can mention its structure very briefly because it takes only a few words, which very few people would understand, I'm sure, but which are simple. It is Brownian motion, which does not proceed in clock time but in trading time; that is, a multifractal function of clock time, so Brownian motion in multifractal trading time. This model is not too easy to understand, actually, even though I am going to argue about trading time in a moment. But if one simply tries to explain it, one has to bring up many, many complications, but I felt that cartoons would be useful. And the cartoon consists simply in taking the price variation from time zero to time one, at zero it is zero, at one it is one. First of all take a linear trend; then you break it by a generator; and you break the generator again and again and again; endlessly- you obtain a curve, which wiggles up and down. That curve, if you alternate appropriately at random intervals of the generator, is remarkably alike to all the curves in the stock market we have. We put in almost nothing. We put in only the kind of quintessence of an idea, which again is a matter of folklore. The folklore is that price records are the same at all stages. You plot a price record from minute to minute or day to day and so on and don't put in the scales- they are all alike. Of course, they're not exactly alike. First of all there is enormous sample variation. Secondly, the world is more complicated than that. But this idea was sufficiently powerful to my pleasure and surprise to provide cartoons that look remarkably like regular prices, namely, they have a range of variation of most changes, which is not constant in time like in Brownian motion; not constant volatility but very variable volatility; and then have many exceedences, both plus and minus. Those exceedences are very large and they come in bunches. Now if these various features had to be fed in separately, which one can do, the model would be of the kind in which you put in everything you get out. Well, when you get out things that you put in deliberately, I don't think you gain much. In general you even lose something, you put in more than what you get out. But in this case you put in not a great deal of knowledge that had been consolidated in various ways about variation of prices, but a general structural idea, namely the idea of scaling, the idea of scaling variants. The idea of fixed points enters because under certain assumptions these distributions constitute fixed points, which is too long to explain. And these philosophical ideas have proven very powerful in model making elsewhere. I have been trying all my life to apply the same kind of modelling, whether it is in physics or in economics or elsewhere. The style is different. In some cases I do have the support of real physical theory; in other cases that support is lacking. However, what is very surprising is by including only those features, even in the very simple cartoon fashions, one obtains artificial 'forgeries' of price records, which many people can't distinguish for a long time from real prices. If you look very carefully you may recognise the real prices because I always use very, very important series that are well known. One may recognise some specific wrinkles that aren't right. This is true also for the forgeries of the mountains. A geologist who looked at my mountain forgeries, after a few minutes of, "Wow! Wow!" said, "Well, it's nice, but it fails on this and that point." That is not, in effect, a defeat. If one can by simple invariance argument get a substantial number of characteristics, then one has a base on which to build a more accurate theory and a base on which to apply the ordinary rules of science, which are: construct a theory that is not based on curve-fitting but on some invariances and general rules if possible; then compare it with the facts; and then use the facts to tune the scaling increasingly. That is exactly what I did.
Benoît Mandelbrot (1924-2010) discovered his ability to think about mathematics in images while working with the French Resistance during the Second World War, and is famous for his work on fractal geometry - the maths of the shapes found in nature.
Title: Cartoons and forgeries
Listeners:
Daniel Zajdenweber
Bernard Sapoval
Daniel Zajdenweber is a Professor at the College of Economics, University of Paris.
Bernard Sapoval is Research Director at C.N.R.S. Since 1983 his work has focused on the physics of fractals and irregular systems and structures and properties in general. The main themes are the fractal structure of diffusion fronts, the concept of percolation in a gradient, random walks in a probability gradient as a method to calculate the threshold of percolation in two dimensions, the concept of intercalation and invasion noise, observed, for example, in the absorbance of a liquid in a porous substance, prediction of the fractal dimension of certain corrosion figures, the possibility of increasing sharpness in fuzzy images by a numerical analysis using the concept of percolation in a gradient, calculation of the way a fractal model will respond to external stimulus and the correspondence between the electrochemical response of an irregular electrode and the absorbance of a membrane of the same geometry.
Duration:
5 minutes, 6 seconds
Date story recorded:
May 1998
Date story went live:
29 September 2010


